This tutorial is for advanced users only!
As Google fixed gcore for Windows, we can finally dump core remotely using gdbserver. I tested GDB on macOS 2 years ago and was working, should still work today and for Linux too. I don't have device running macOS and Linux at the moment
Important:
A good internet connection is required for better debugging experience. 5GHz Wi-Fi and Ethernet is highly recommended.
Root is required.
Samsung devices with KNOX and/or other phones with security may prevent GDB from working. Use custom rom or custom kernel that doesn't have such security system. Or just buy old devices or buy crappy chinese devices that doesn't have any super security. That's the reason I use Denver tablets all time XD.
Some emulators does not support core file generation but Bluestacks support it.
Downloads:
Download the correct file for your device CPU architecture. You can check your CPU architecture using CPU-Z app
GDB server:
Android arm64: Link 1 | Link 2
Android armv7: Link 1 | Link 2
Android x86: Link 1 | Link 2
Android x86-64: Link 1 | Link 2
GDB client:
Windows x86 (32-bit): Link 1 | Link 2
Windows x86-64: Link 1 | Link 2
macOS (Darwin) x86-64: Link 1 | Link 2
Linux x86-64: Link 1 | Link 2
Instructions:
Installation:
On PC, extract the folder into your desired folder.
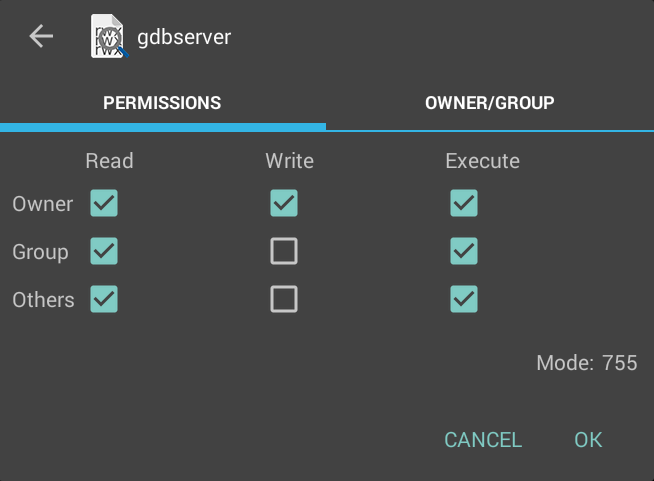
On Android device, add the gdbserver file to /system/bin and give gdbserver file permission 755. If you are using X-plore, make sure you enable superuser + writeable in confuguration.

Attach the process and start the server:
Open up the Terminal, grand superuser/root access
Show all process list
Or search text
Find a pid number of process you want to attach and note down so you will remember it
Running gdbserver and attaching to a running process:
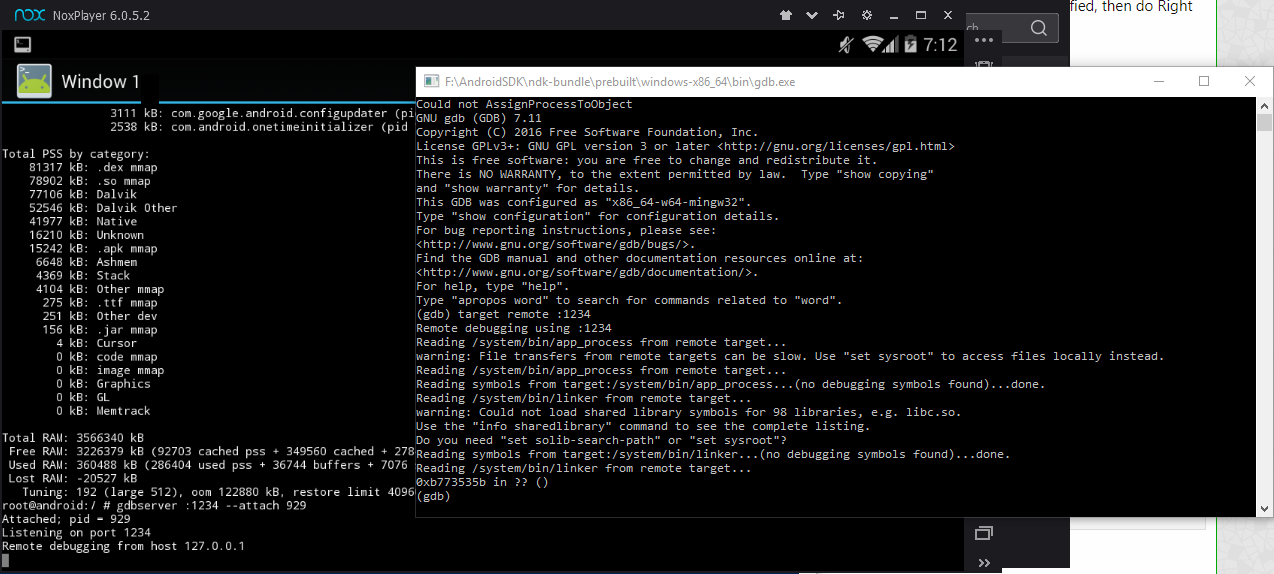
Run gdbserver on the target system with TCP connection and attach to the pid number of process. Just give port 1234
gdbserver will listen on port and waiting for you to connect.
Connecting to gdbserver:
Execute the gdb file located in /bin/ (gdb.exe Windows)
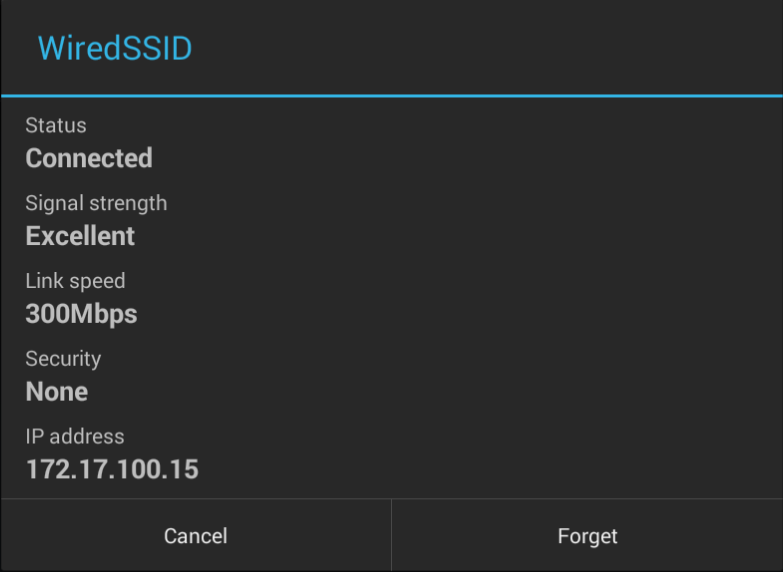
Target your device's IP:Port. You can find your device's IP on Wifi settings (Kitkat and below) or Status (Lollipop and above)

That's all, now you can use GDB for debugging and dumping remotely.
I'll look into GDB game hacking later. For now, you can read iOS GDB hacking tutorials
To dump use
Please note that dumping core to your PC may take 2-5 minutes depending on performance and network speed
Targeting emulator:
Forward TCP
Then in GDB, you can target your emulator.
Some emulators required you to enable USB debugging and connect adb manually. For example Nox Player, do this to connect to localhost.
Then forward TCP
How to connect Android Studio with Nox App Player for Android development and debug | NoxPlayer

Credits:
Google (GDB)
iAndroHacker (Tutorial)
As Google fixed gcore for Windows, we can finally dump core remotely using gdbserver. I tested GDB on macOS 2 years ago and was working, should still work today and for Linux too. I don't have device running macOS and Linux at the moment
Important:
A good internet connection is required for better debugging experience. 5GHz Wi-Fi and Ethernet is highly recommended.
Root is required.
Samsung devices with KNOX and/or other phones with security may prevent GDB from working. Use custom rom or custom kernel that doesn't have such security system. Or just buy old devices or buy crappy chinese devices that doesn't have any super security. That's the reason I use Denver tablets all time XD.
Some emulators does not support core file generation but Bluestacks support it.
Downloads:
Download the correct file for your device CPU architecture. You can check your CPU architecture using CPU-Z app
GDB server:
Android arm64: Link 1 | Link 2
Android armv7: Link 1 | Link 2
Android x86: Link 1 | Link 2
Android x86-64: Link 1 | Link 2
GDB client:
Windows x86 (32-bit): Link 1 | Link 2
Windows x86-64: Link 1 | Link 2
macOS (Darwin) x86-64: Link 1 | Link 2
Linux x86-64: Link 1 | Link 2
Instructions:
Installation:
On PC, extract the folder into your desired folder.
On Android device, add the gdbserver file to /system/bin and give gdbserver file permission 755. If you are using X-plore, make sure you enable superuser + writeable in confuguration.
Attach the process and start the server:
Open up the Terminal, grand superuser/root access
Code:
suShow all process list
Code:
dumpsys meminfoOr search text
Code:
dumpsys meminfo | grep (string of package name, com.*, whatever…)Find a pid number of process you want to attach and note down so you will remember it
Running gdbserver and attaching to a running process:
Run gdbserver on the target system with TCP connection and attach to the pid number of process. Just give port 1234
Code:
gdbserver :<port> --attach <pid>gdbserver will listen on port and waiting for you to connect.
Code:
Attached: pid = <pid>
Listening on port <port>
Connecting to gdbserver:
Execute the gdb file located in /bin/ (gdb.exe Windows)
Target your device's IP:Port. You can find your device's IP on Wifi settings (Kitkat and below) or Status (Lollipop and above)
Code:
target remote <ip>:<port>That's all, now you can use GDB for debugging and dumping remotely.
I'll look into GDB game hacking later. For now, you can read iOS GDB hacking tutorials
To dump use
Code:
gcore <path to your hard drive>Please note that dumping core to your PC may take 2-5 minutes depending on performance and network speed
Targeting emulator:
Forward TCP
Code:
adb forward tcp:<port> tcp:<port>Then in GDB, you can target your emulator.
Code:
target remote :<port>Some emulators required you to enable USB debugging and connect adb manually. For example Nox Player, do this to connect to localhost.
Code:
nox_adb.exe connect 127.0.0.1:62001Then forward TCP
Code:
nox_adb.exe forward tcp:1234 tcp:1234How to connect Android Studio with Nox App Player for Android development and debug | NoxPlayer
Credits:
Google (GDB)
iAndroHacker (Tutorial)
